Operations Page
The Operations page provides real-time monitoring and visualization of cyclist and mobility usage, with detailed views of vehicle locations, route information, and capacity status. The interface is divided into two main sections: Full Transit View and Route View.
Full Transit View
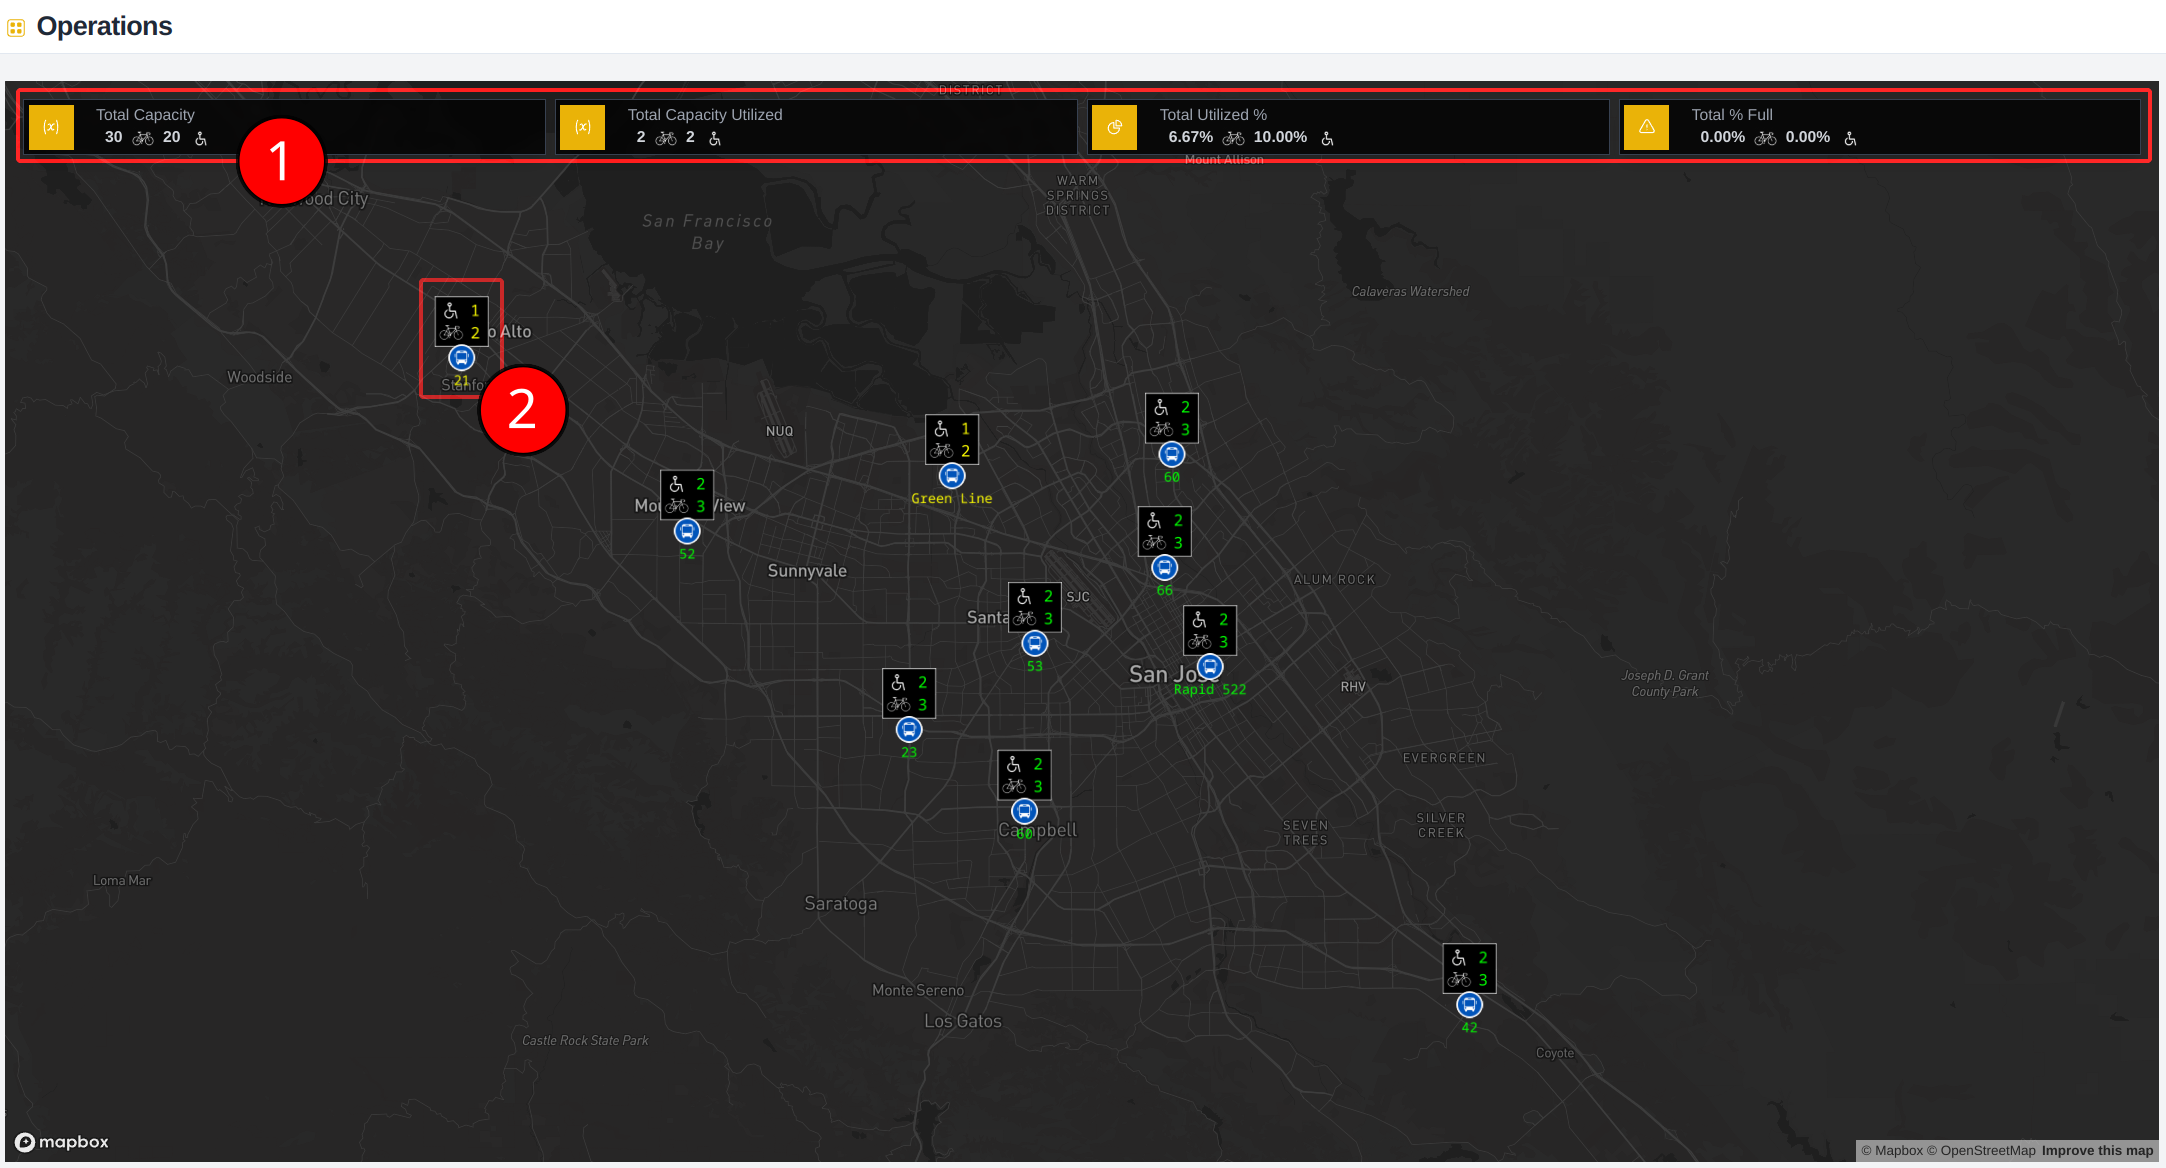
1. Aggregate Usage Statistics
The top section displays system-wide statistics for:
- Cyclist and mobility availability
- Cyclist and mobility usage
- Total system capacity utilization
2. Vehicle Status Indicators
Each vehicle on the map is represented by a marker with color-coded capacity status, and assigned route:
- Green: Full capacity available
- No current usage, full capacity available
- Yellow: Partial capacity in use
- Either cyclist racks or mobility seating is partially occupied
- Red: No capacity available
- Either cyclist racks or mobility seating is fully occupied
Route View
To access the Route View, click any vehicle on the map.
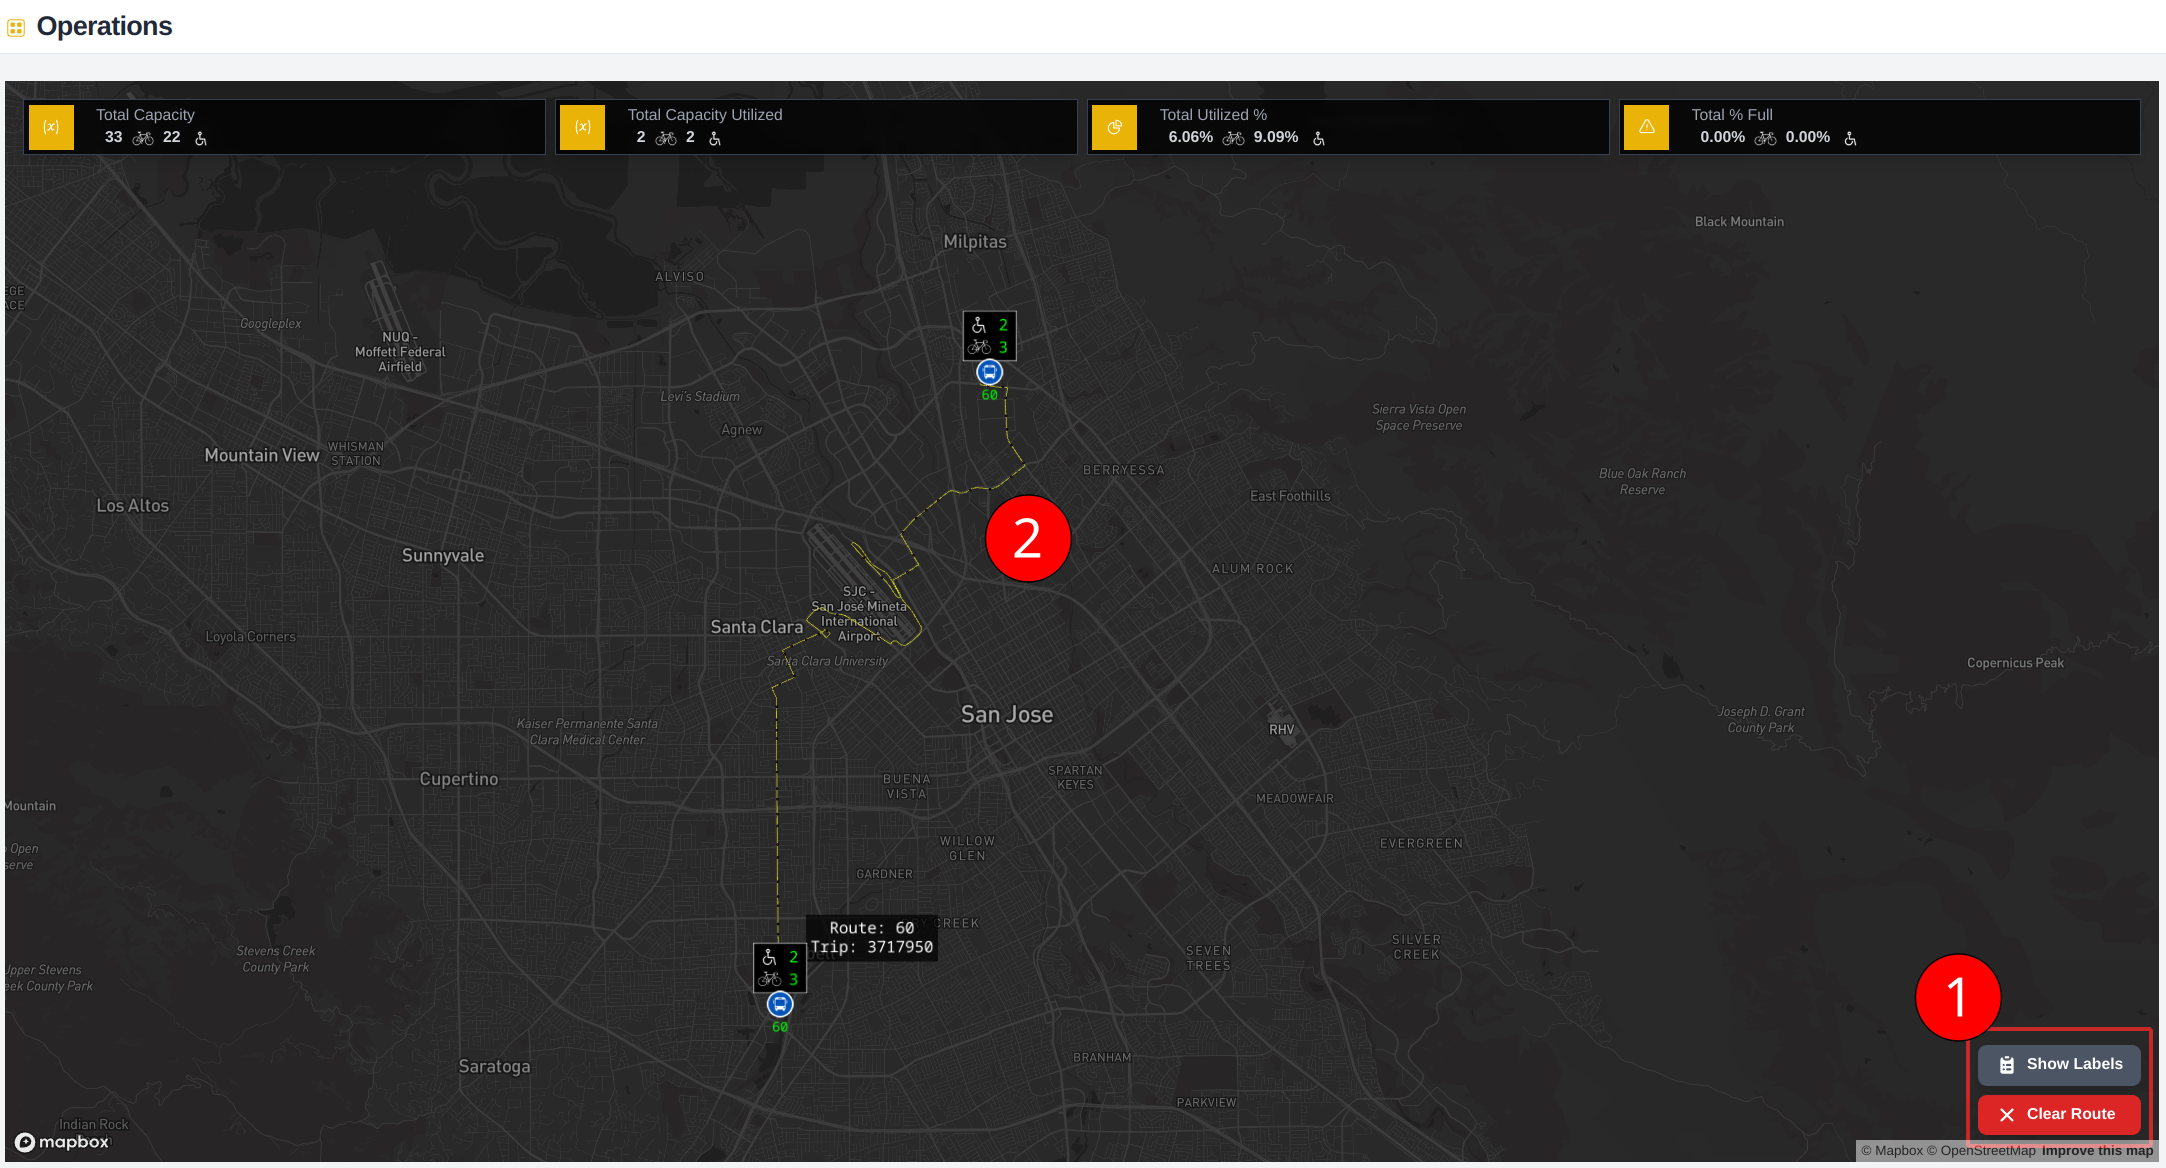
1. Control Panel
The control panel offers two main functions:
- Clear Route: Remove the current route selection and return to full transit view
- Show Labels: Toggle stop information labels on/off
2. Route Visualization
When a route is selected:
- Route path is highlighted in yellow
- All route stops are displayed
- Only vehicles operating on the selected route are shown
- Real-time vehicle positions are still updated continuously
Stop Information Labels
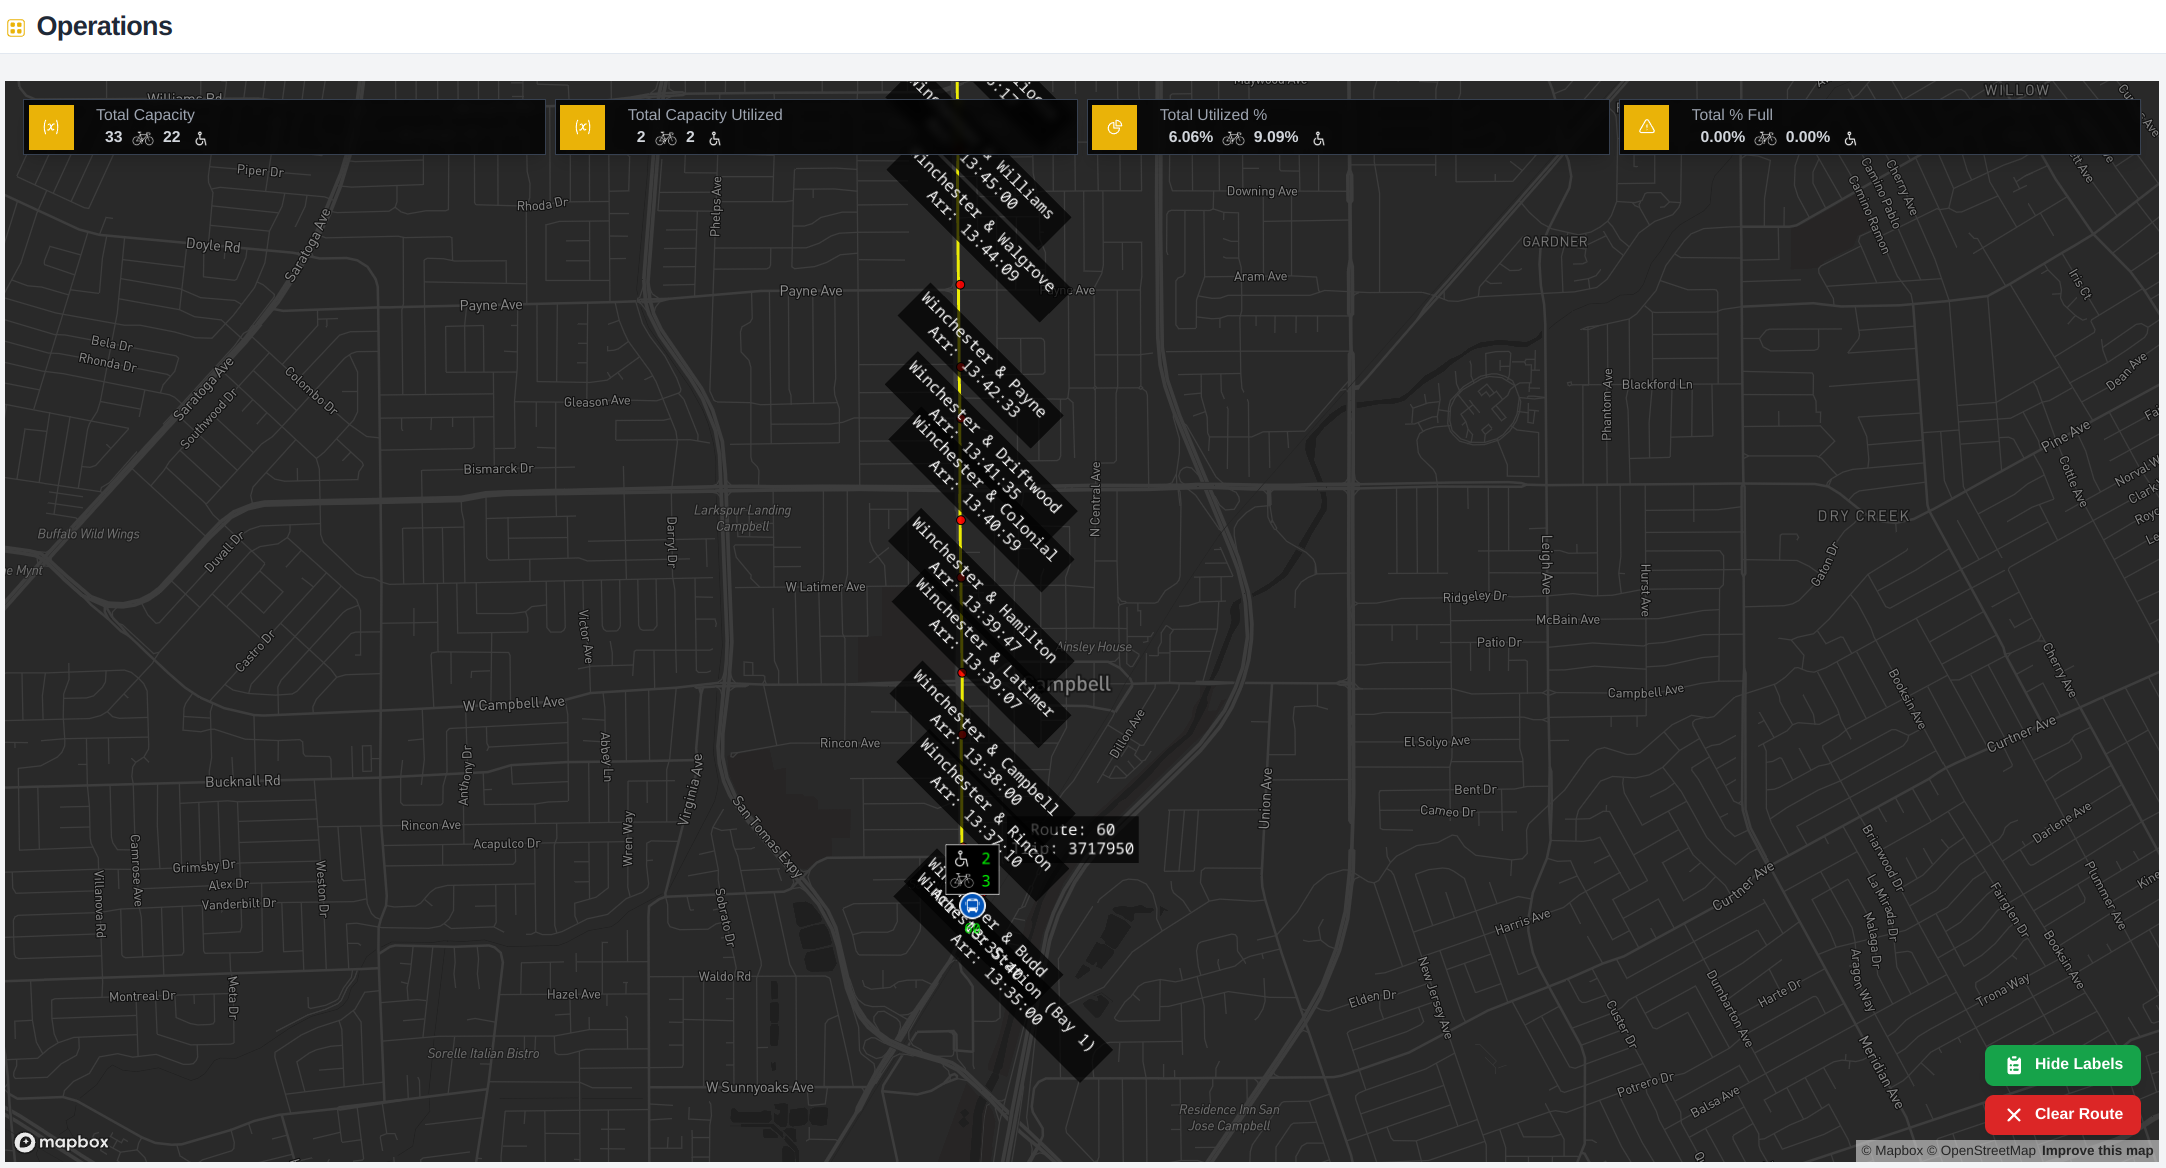
When "Show Labels" is activated, each stop displays:
- Stop location name
- Estimated arrival time for the selected vehicle
note
Alternatively, you can hover over any stop without Show Labels to view stop information.
Tips for Effective Use
tip
- Use the full transit view for system-wide monitoring
- Switch to route view for detailed route analysis
- Use route view to answer availability questions
- Selecting other vehicles on the route can help identity arrival of capacity at a stop location